Why The Yield Curve Does Not Predict A Market Downturn
The U.S. Treasury bond yield curve is in the news again after briefly turning negative earlier this month. The financial media is trumpeting this event as an indicator that a recession will likely follow with a concomitant stock market decline. I suggest that this indicator is not useful in predicting either one.
The yield curve is a plot of current U.S. Treasury bond interest rates (Y-axis) based on their maturities from two-year to thirty-year (X-axis). Ordinarily shorter-maturity rates are lower than longer-maturity rates (causing the curve to slope upwards) because of the time value of money: when you buy a ten-year treasury bond you are lending money to the government for ten years, hence the demand for a higher return as compared to buying a two-year bond. Occasionally the slope will invert (i.e. short-term bond rates become higher than long term) when the Federal Reserve, which only has the ability to control short-term rates, raises them faster than the broad market’s view of what the long-term rate should be.
For simplicity the Federal Reserve calculates the yield curve as the difference between the two-year and the ten-year rates. As you can see from the chart below (extreme right), the ten-year rate dipped below the two-year rate earlier this month.
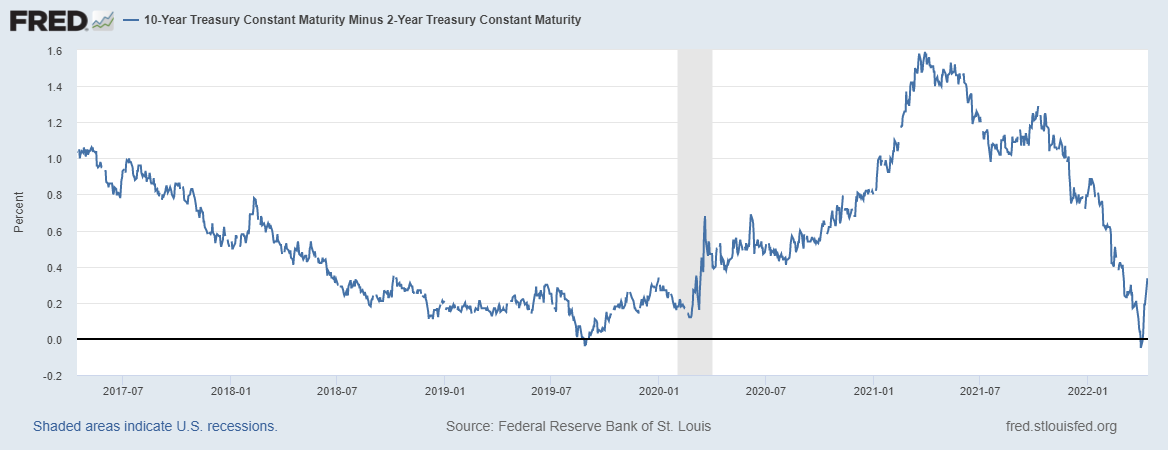
You can also see from the chart that the last time an inversion occurred was in August 2019, and it was followed by a recession (shaded area) about six months later. In fact every recession since the mid-1970s has been preceded by an inverted yield curve.
The yield curve is not a sufficient recession indicator for several reasons. First, the cause of an inversion is generally a Fed-generated interest rate increase (typically for the purpose of controlling inflation). If they raise rates too aggressively a recession could be an outcome. But as a counter-example the 2020 recession shown in the graph above was arguably the result of COVID-induced lockdowns and other economic disruptions clearly independent of Fed actions. In addition, given the very small sample size (only six recessions over the last 45 years) there’s not enough data to conclude a cause and effect with any statistical significance.
What about your investment portfolio? Even if a yield curve inversion did portend a recession, and a recession is always accompanied by a market downturn, the challenge is timing. The lag time between an inversion and a subsequent market decline has varied widely, from a low of 7 months in 2020 to a high of 22 months between the December 2005 inversion and the consequent market correction beginning October 2007. If you had treated each occurrence as a trigger to sell out of the market you would have missed out on double-digit returns five out of the six times before the subsequent market decline actually began. After the August 1978 yield curve inversion in particular you would have given up a gain of over 120%!
As a market timing signal, the yield curve indicator doesn’t provide enough information to avoid a market downturn without forgoing the market gain that often precedes it. As always a more reliable approach is to follow an investment strategy that is resilient enough to weather downturns regardless of the cause. That way you don’t have to spend your time worrying about possible future events over which you have no control.