Is The Yield Curve Signaling a Recession?
You may have heard through the financial media that the U.S. Treasury yield curve has been flattening, portending a possible recession in the near-term. As of this writing the yield curve is at its flattest point since 2007. Exactly what is the yield curve, and is it truly a good indicator of a future economic downturn?
The Treasury yield curve (simplified) is the difference between the current two-year and ten-year U.S. Treasury bond rates. Ordinarily the two-year rate is lower than the ten-year rate, resulting in a positively-sloped curve if you were to graph it. It is a function of the time value of money. If you buy a ten-year bond you are lending money to the government for ten years, hence the demand for a higher return as compared to only a two-year loan. When the spread between these two bond rates is high, that is an indicator of solid economic growth. As the spread narrows, the curve flattens. Occasionally the slope will invert (i.e. short-term bond rates become higher than long term). This can occur when the Federal Reserve, which only has the ability to control short-term rates, raises them faster than the broad market’s view of what the long-term rate should be.
Does a flattening yield curve indicate an upcoming recession? There is no statistical correlation between the two historically. It’s a different story, however, when the yield curve becomes inverted. The following chart from the Federal Reserve Bank of St. Louis displays the difference between the ten-year rate and the two-year rate. Every recession (the shaded regions) since the mid-1970s has been preceded by an inverted yield curve (indicated by the graph dipping below 0%):
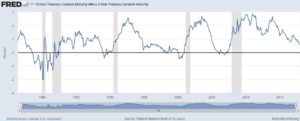
Although we are dealing with a small sample size, the ability of the inverted yield curve to predict upcoming recessions appears to be pretty definitive. The challenge, though, is the timing. How long after short bond yields exceed long bond yields will the next recession occur? As you can see from the chart, the lag time has been quite variable, from a low of 10 months when the yield curve first inverted in September 1980, to a high of 24 months in December 2005. If the curve were to become inverted this coming October, for example, how many months later would the recession begin? It is impossible to predict based on the historical data.
More importantly for investors, what impact did these yield curve inversions and their subsequent recessions have on the stock market? During all five recessions the associated market corrections were all double-digit negative. The smallest began one month after the January 1980 recession and resulted in a 17% decline in the S&P 500. The worst began two months before the December 2007 recession, after which the S&P 500 experienced a 56% drawdown before turning around in March 2009.
Would it make sense to take the extremely conservative position of cashing out of the stock market right after a yield curve inversion so as to avoid any possible future market decline? If you had done so in December 1988 you would have missed out on a 37% S&P 500 gain before the market correction hit. In fact, during four out of the five periods between the time the yield curve inverted and the start of the subsequent recession, the S&P 500 experienced double digit returns. In other words, acting too soon would have cost an investor dearly.
As a market timing signal, the yield curve indicator doesn’t give us enough information to avoid a likely market downturn without having to give up the market gains that often precede it. This has always been one of the key problems with making investment decisions based on market timing, and no one has ever figured out how to make it work reliably.
(Thanks to Ben Carlson of Ritholtz Wealth Management for providing the data.)
One Response
Clear and succinct, thanks. Too bad it’s probably too late for an (overdue) market crash before the November elections. Bring it on!
I interpret the yield curve as kind of a Delphi poll. When flat/inverted, it means a majority of bond investors don’t feel very good about longer-term performance prospects.