Market Declines Are More Common Than You Think
It may seem that the U.S. stock market has been the place to invest your savings over the last few years. The S&P 500 returned 32% in 2019, 18% in 2020, and is currently up almost 20% so far this year. That’s well above its 50-year average annual return of slightly over 10%. During periods like this it’s easy to become complacent and forget that the stock market also experiences downturns. And they occur with much greater frequency that you might imagine.
The chart below from Calamos Investments shows yearly S&P 500 performance over the past 40 years. The dark blue bar indicates the end-of-year return, while the green-outlined bar shows the biggest decline within each year. (Don’t get confused by the mislabeling on the x-axis).
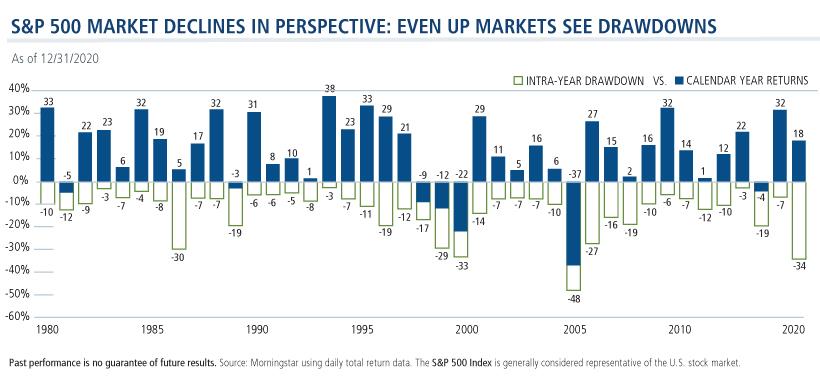
The bad news: over the last forty years the S&P 500 has experienced a decline of at least 3% every single year. In fact, during more than half of those years the maximum intra-year pullback was greater than 10%. And on average it was 13%. Those were not insignificant hits to your portfolio.
The good news: despite all those market declines the S&P 500 still managed to end each year with gains over 82% of the time. Note also that in the years following those with the three biggest intra-year declines market returns were all very strong.
What should we take away from all this? Stock market investing is volatile and losses occur with regularity. In spite of that it remains one of the most consistent ways of growing your savings for the longer term as long as you don’t overreact to the downturns in the shorter term.